
Engineering Verification
ISCWSA Reference Comparison Results
DirectionalPlan calculations compared with published ISCWSA survey uncertainty and R4 clearance examples. These comparisons were performed by DirectionalPlan and do not constitute ISCWSA certification or endorsement.
Survey Uncertainty
Covariance Matrix Comparisons
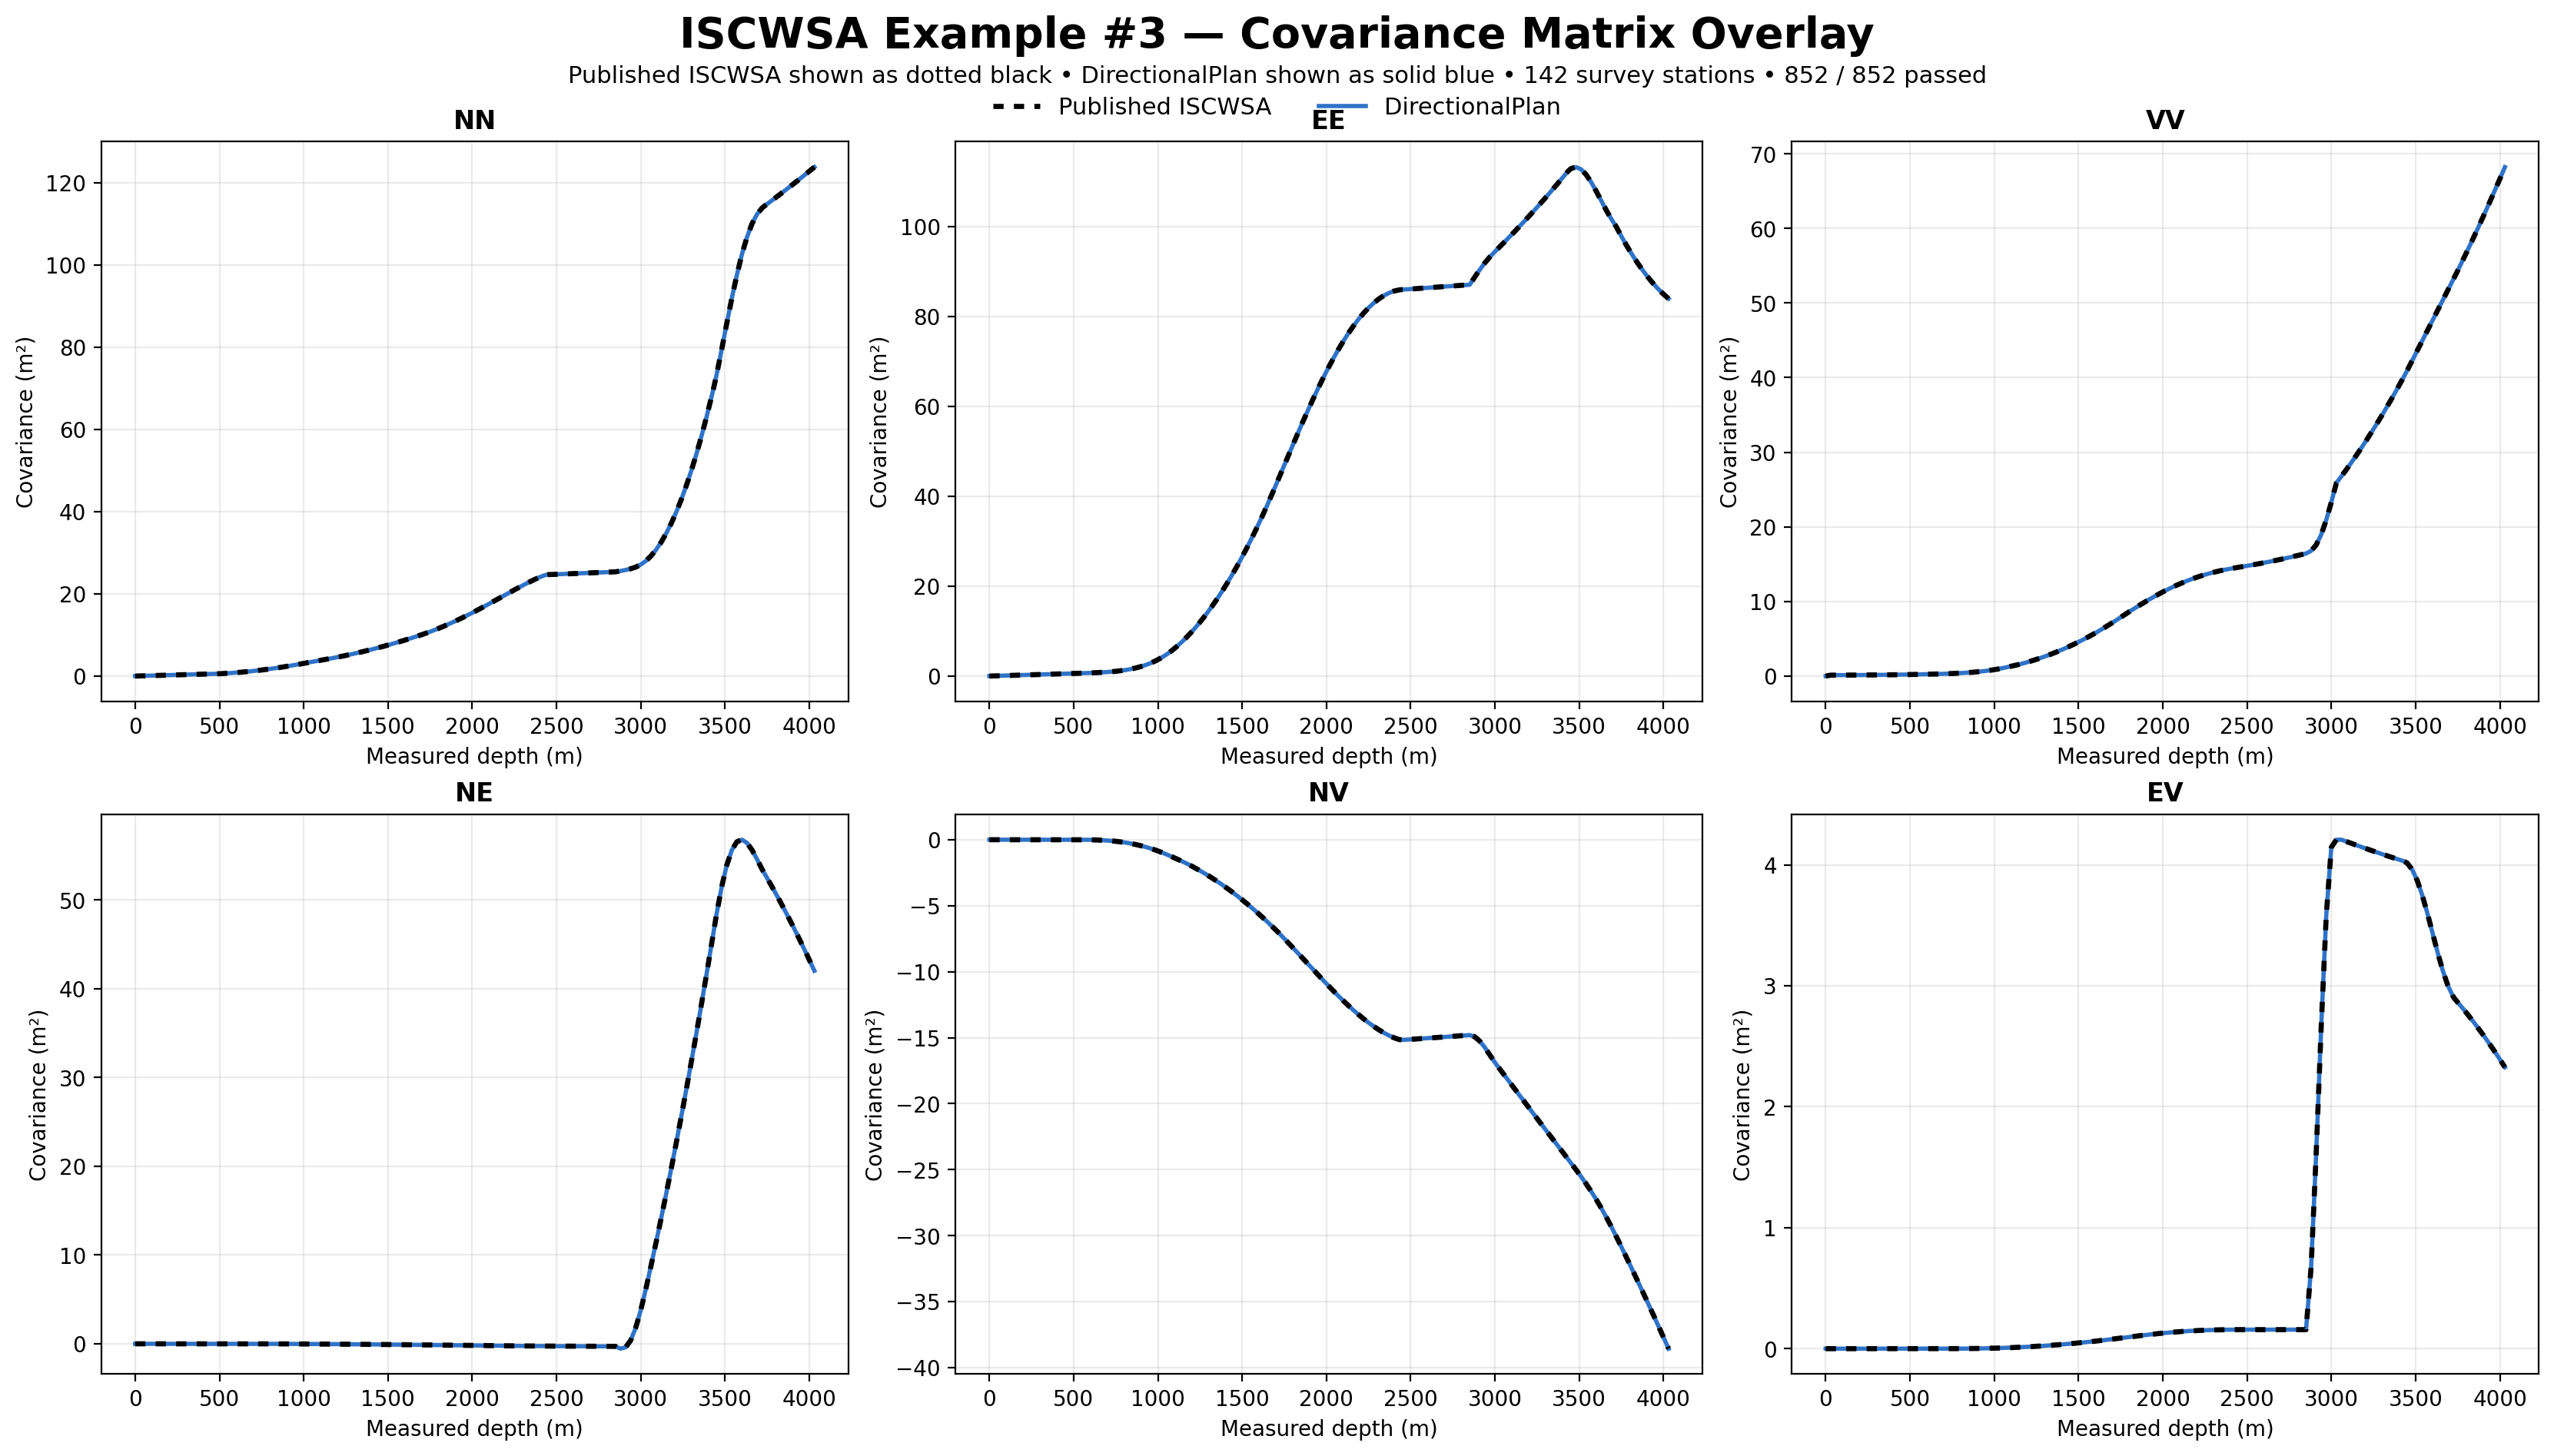
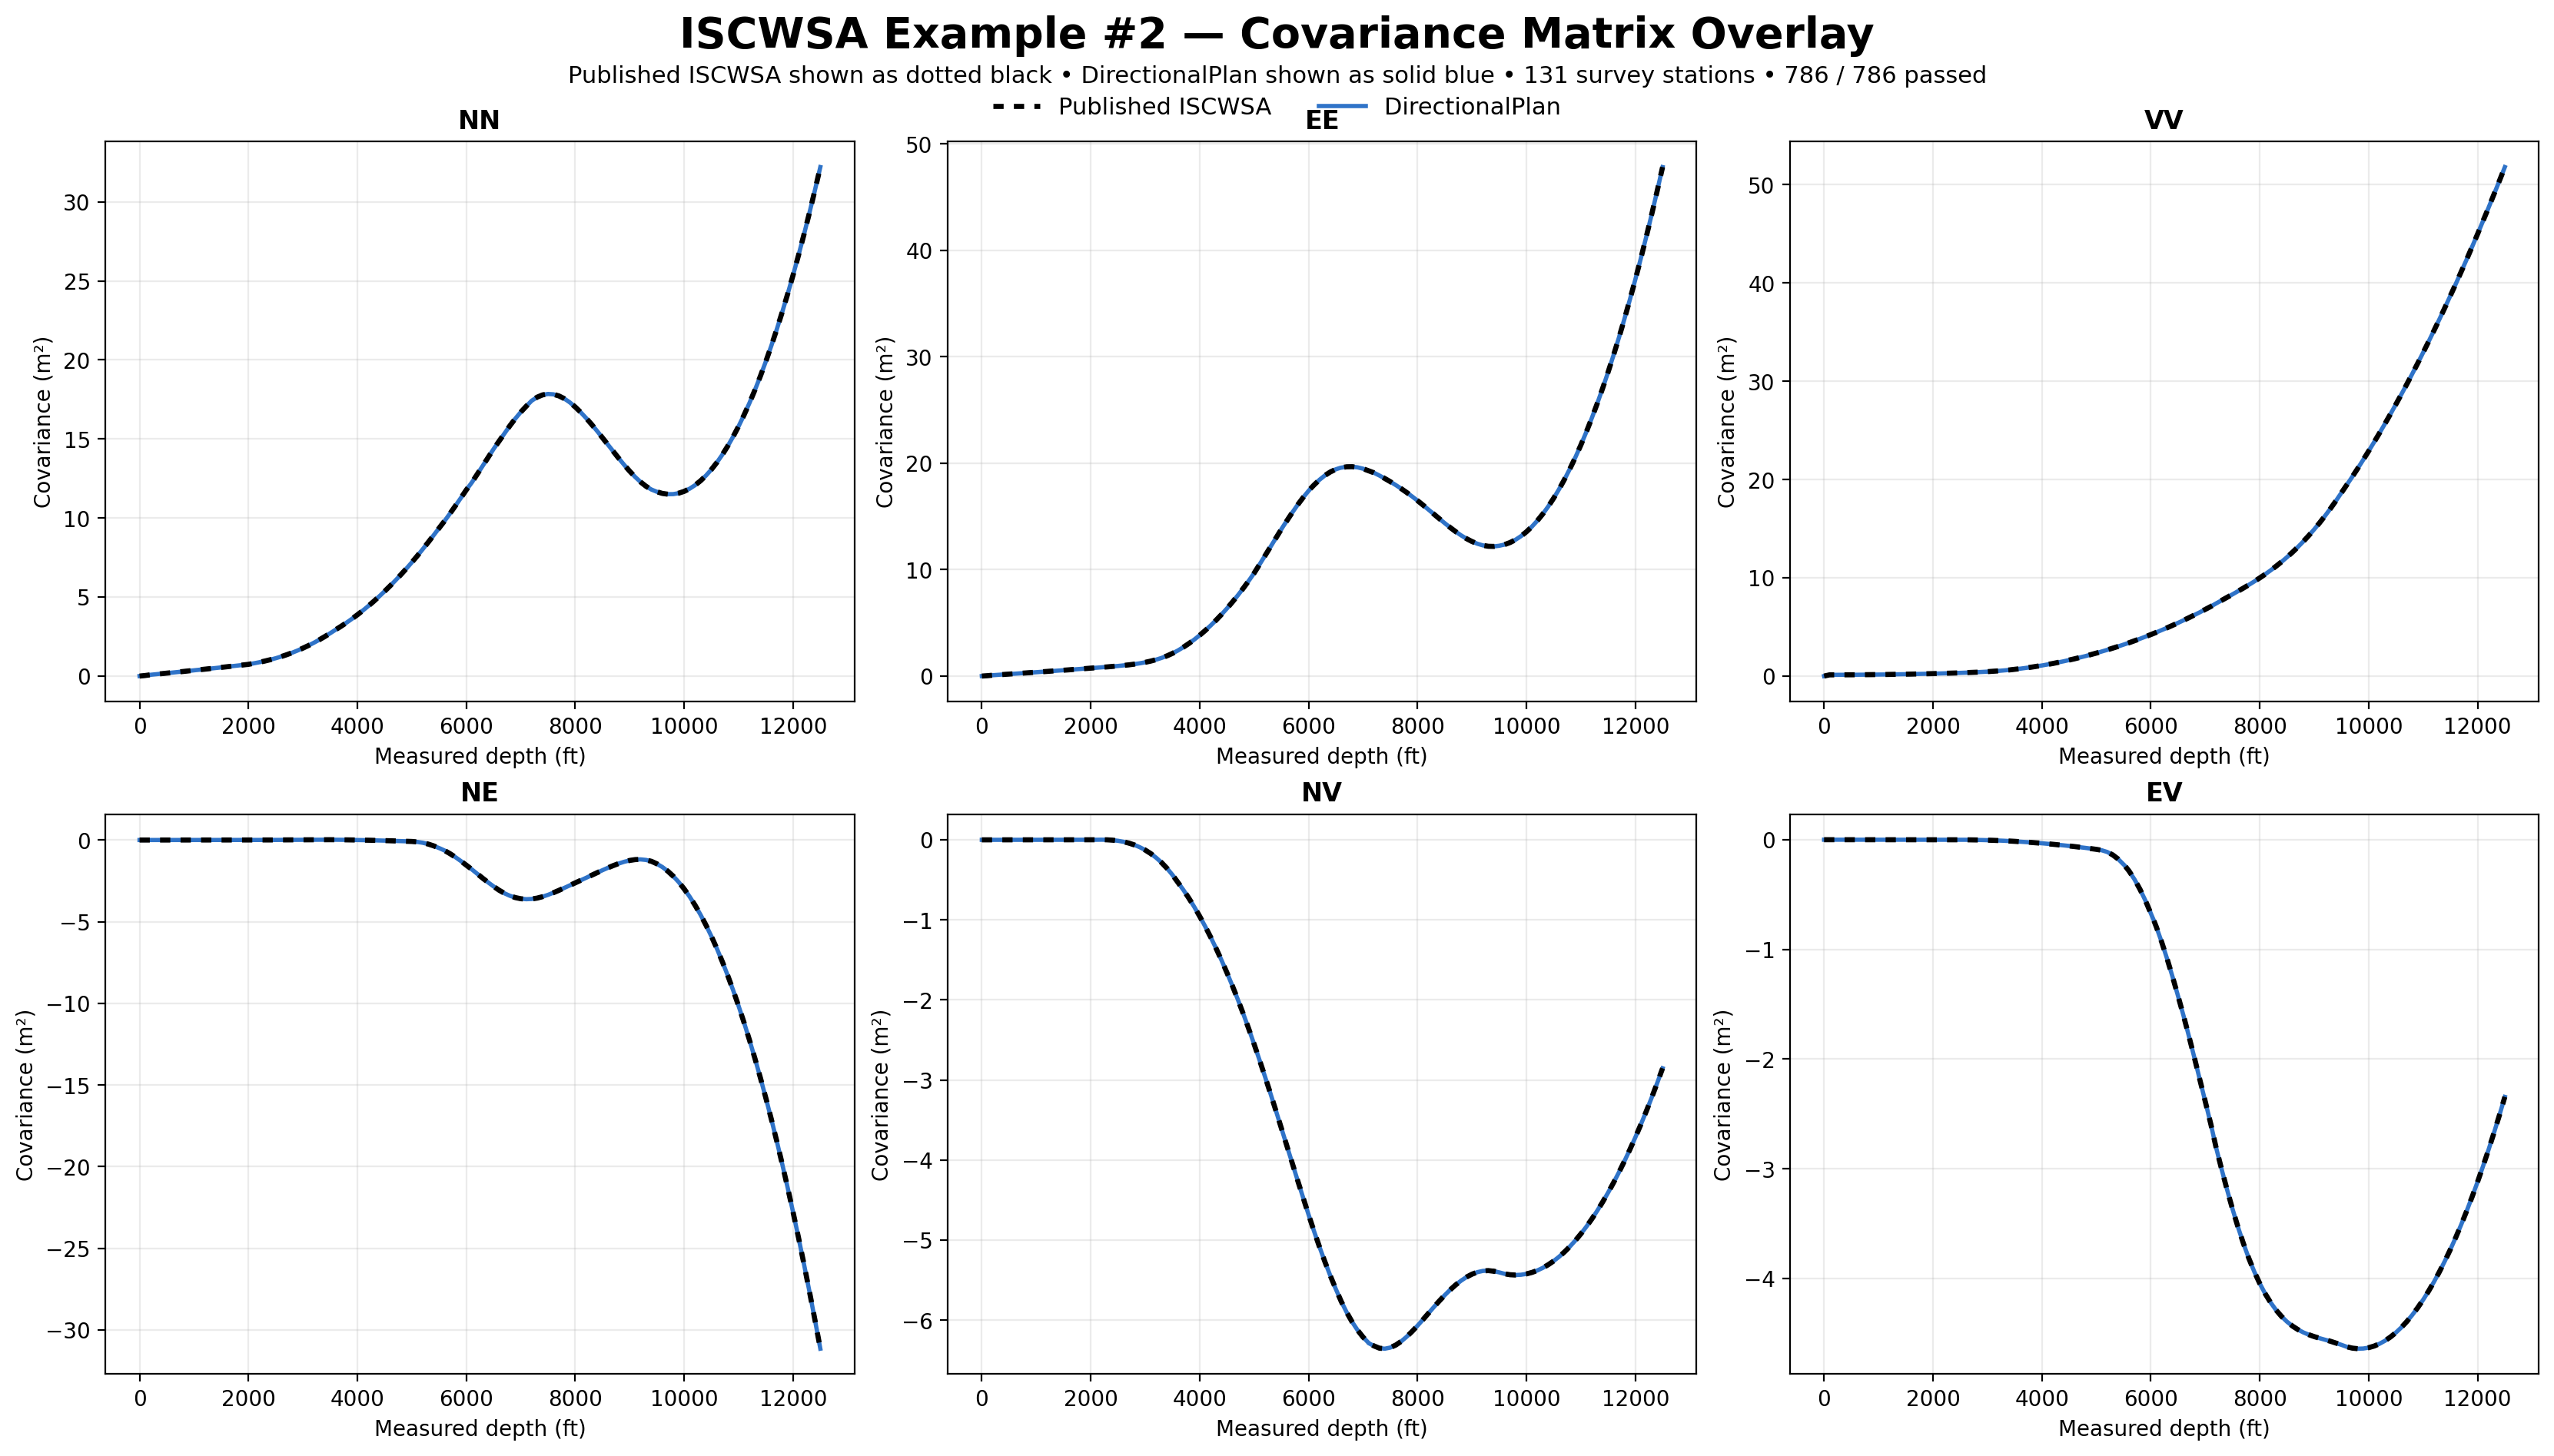
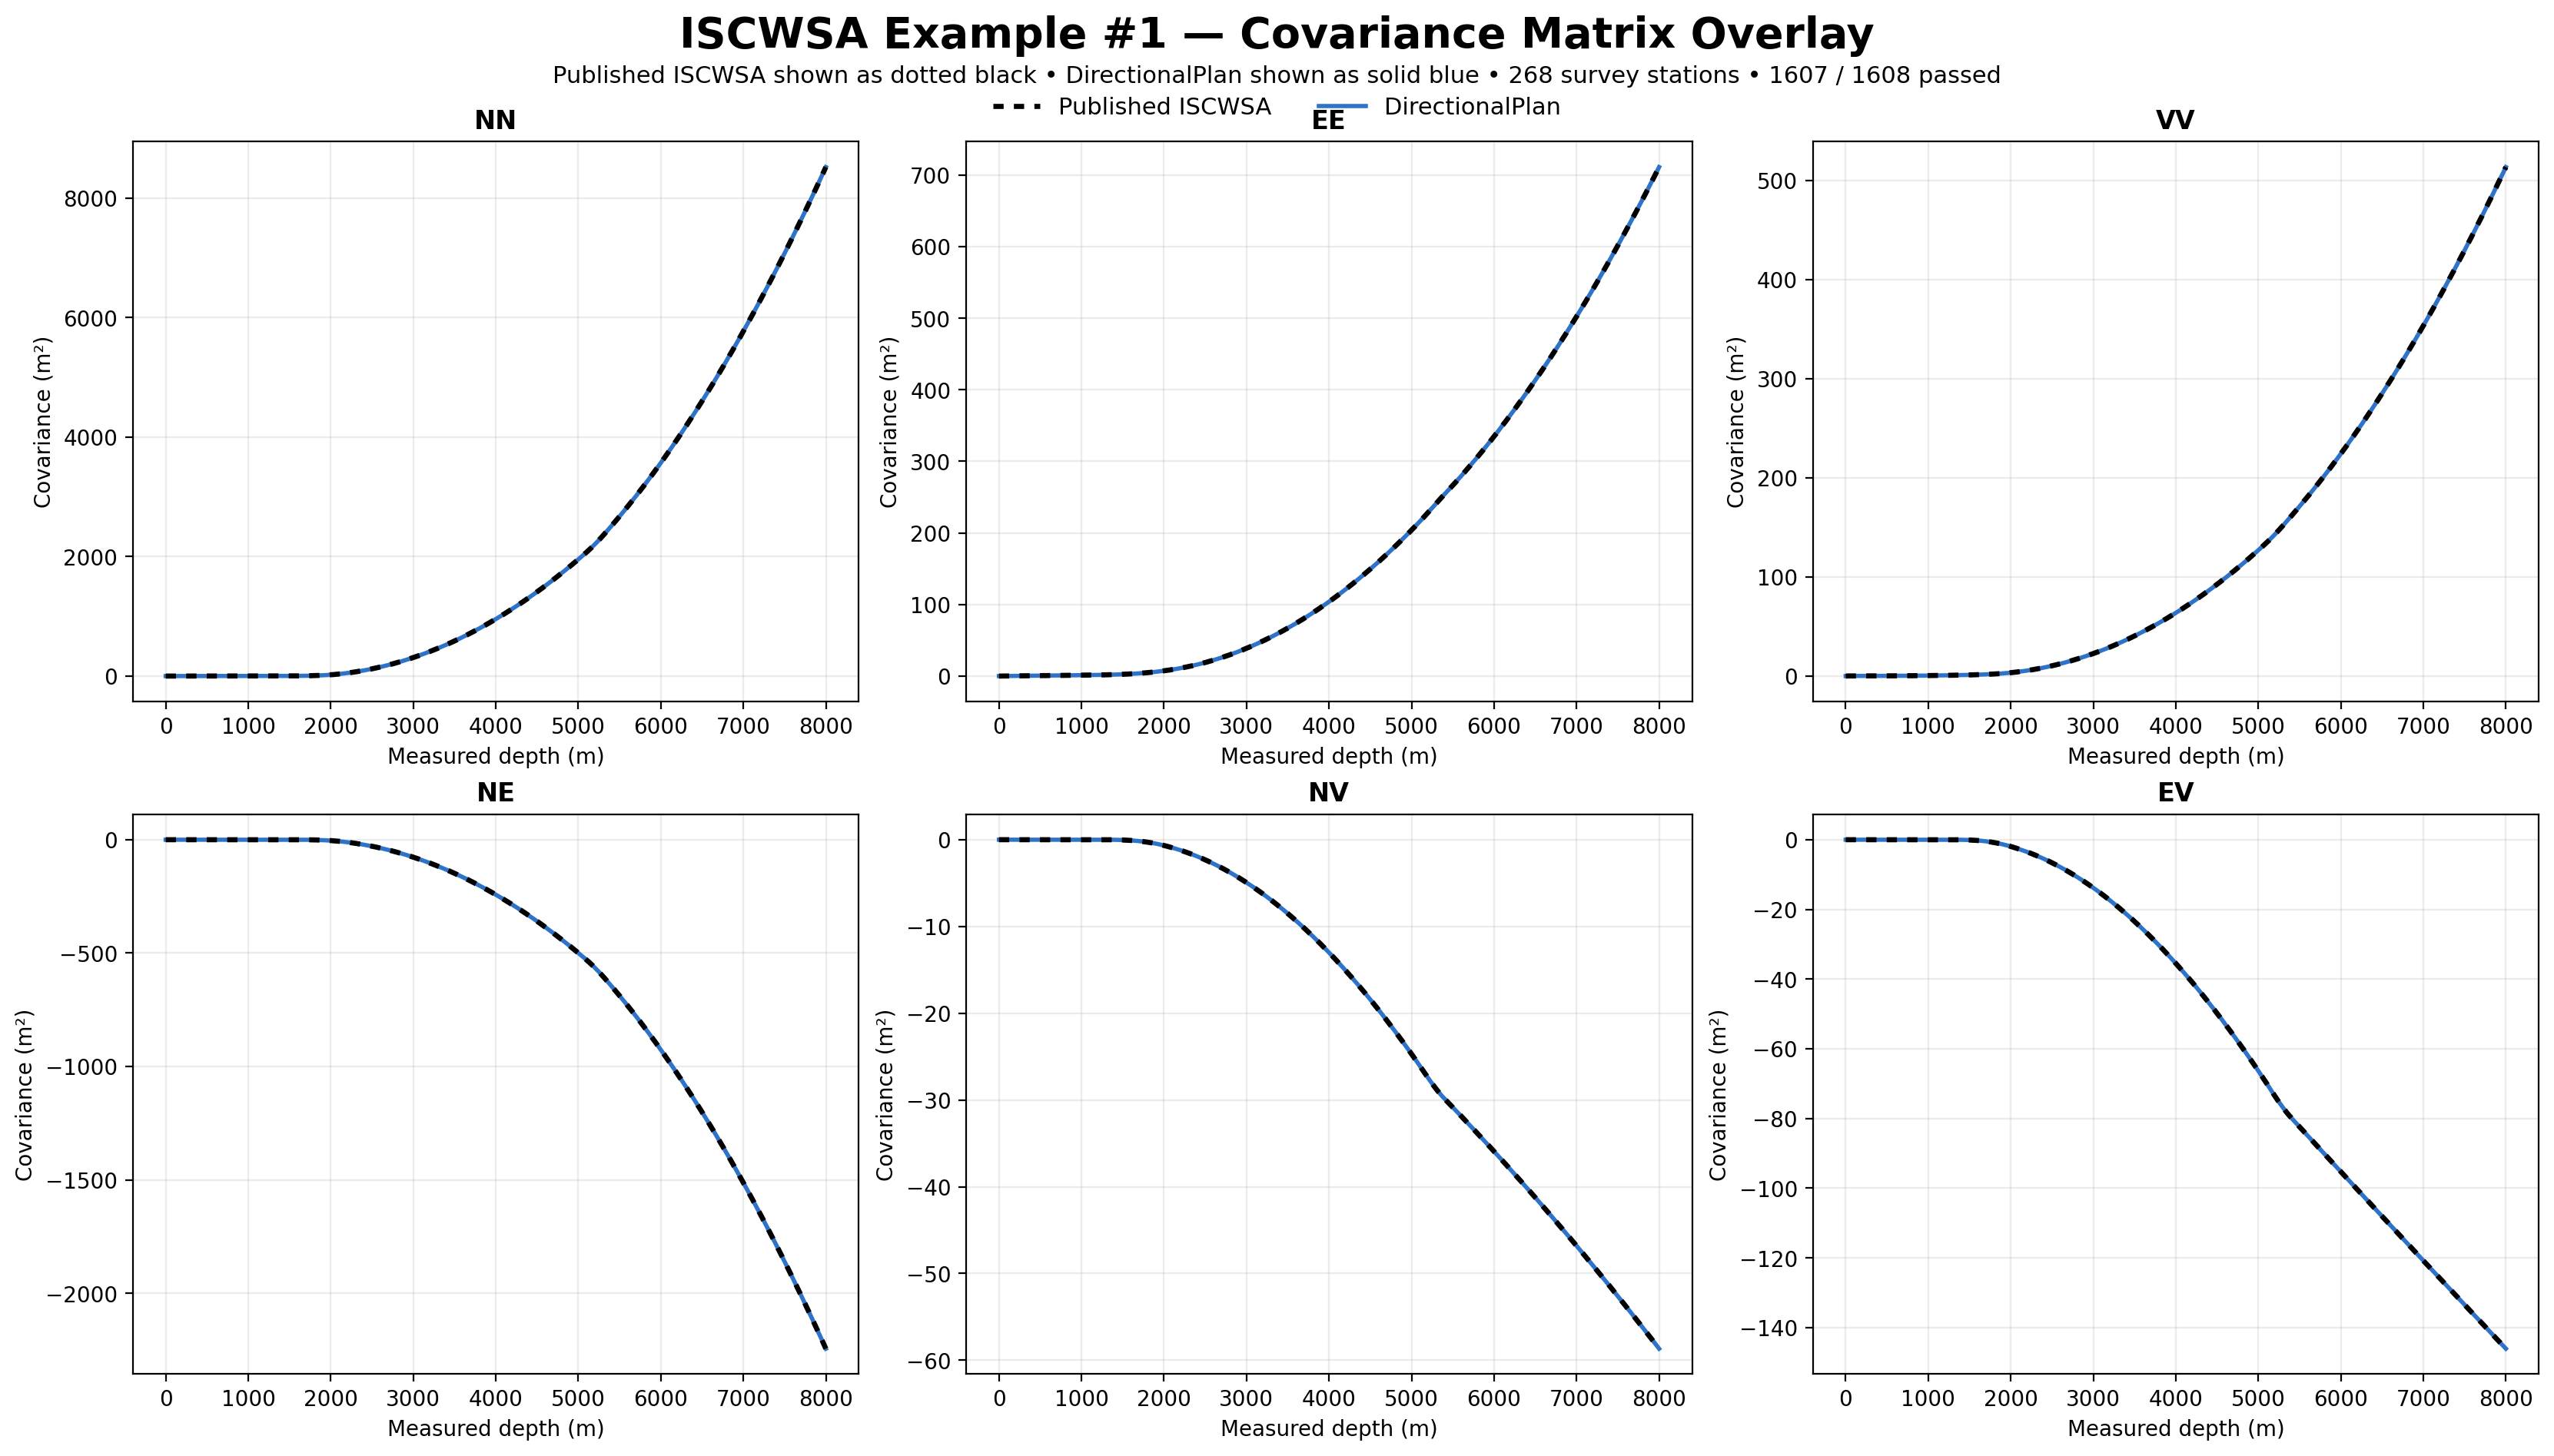
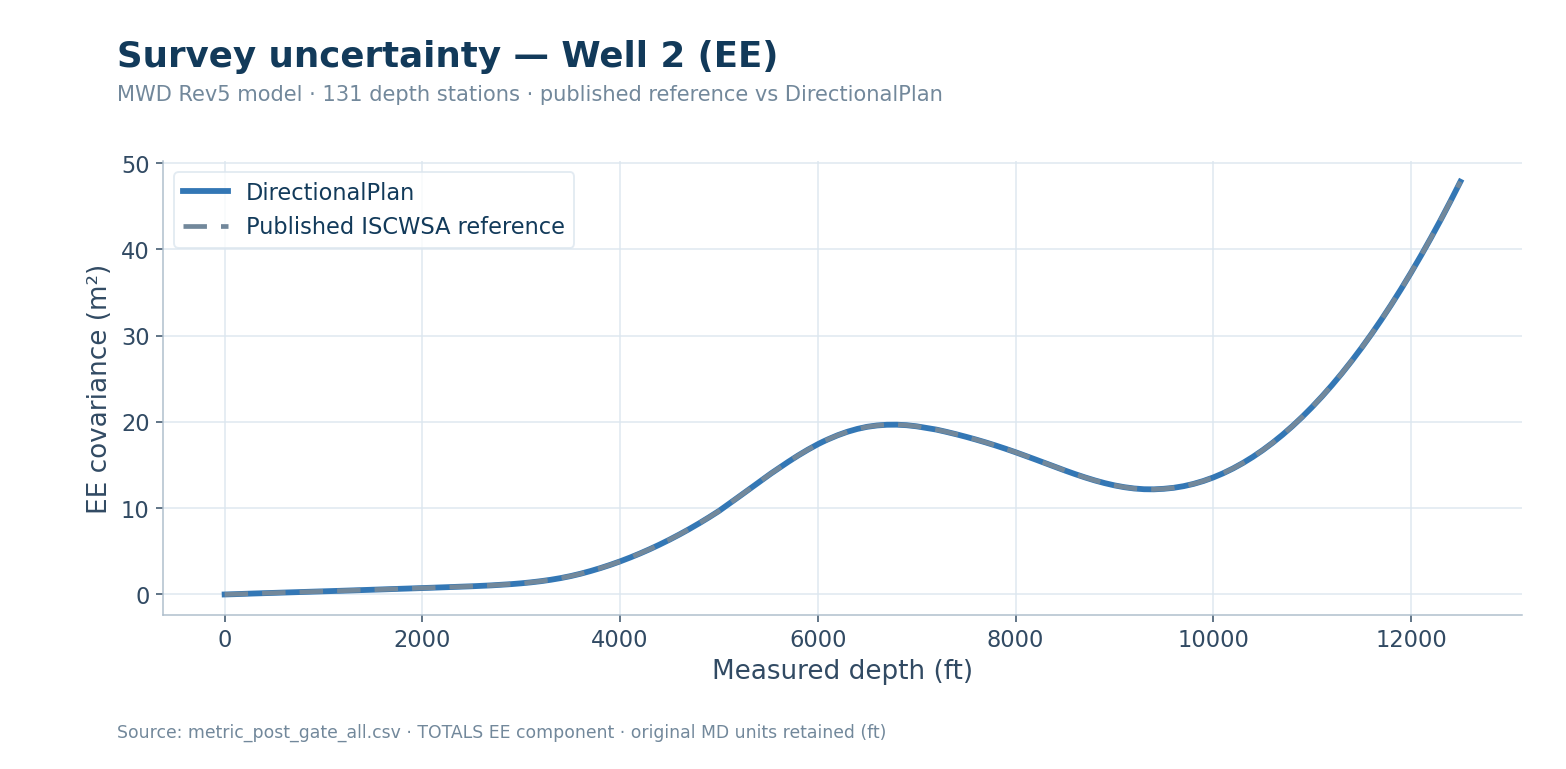
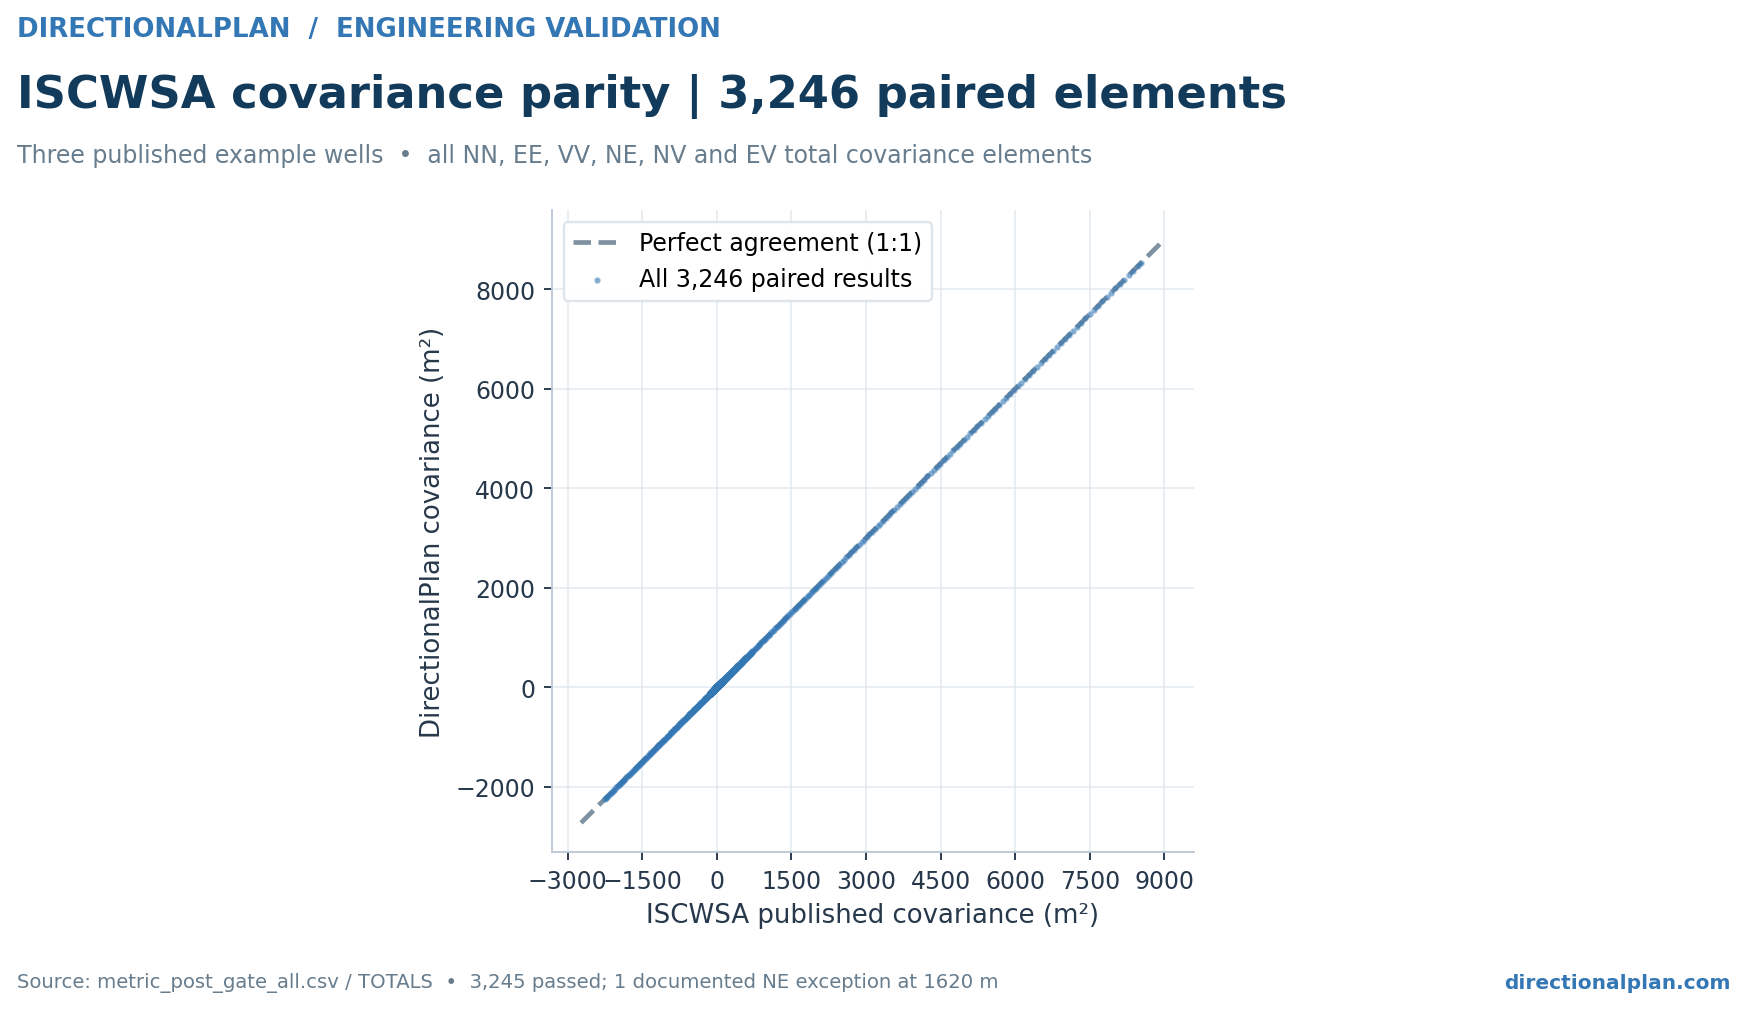
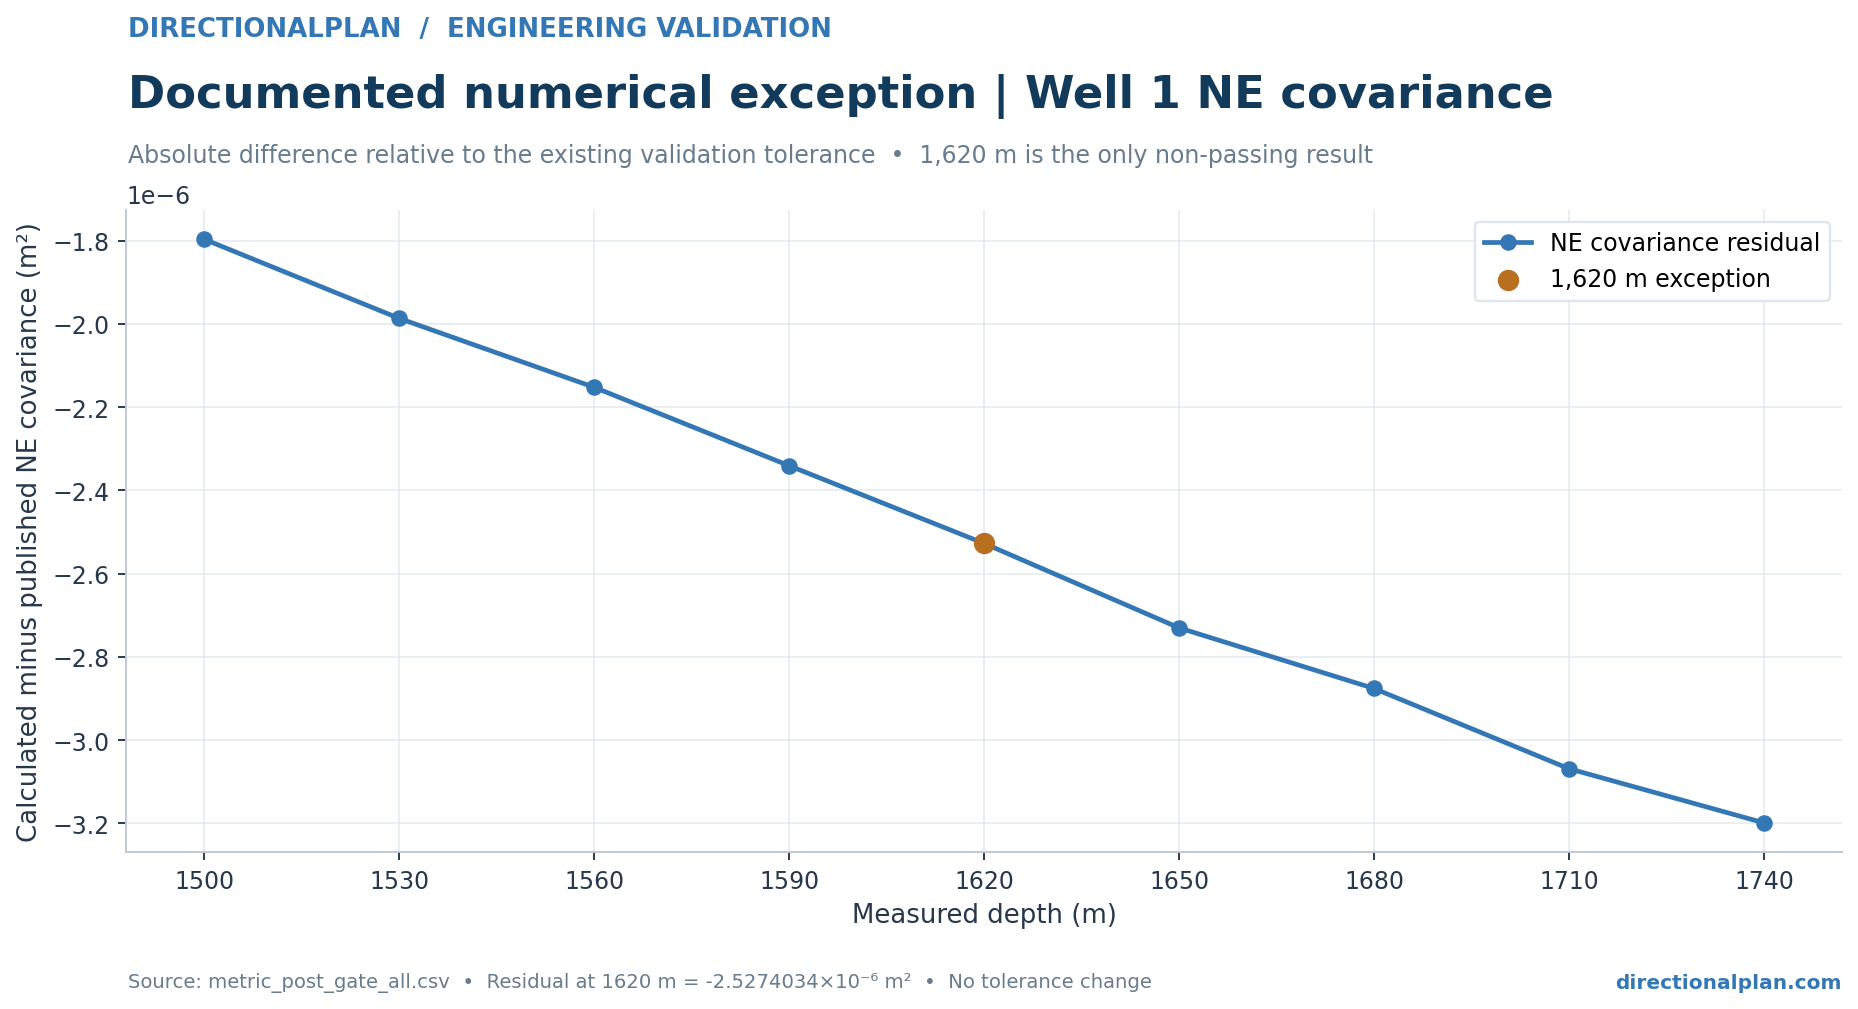
Three ISCWSA error-model example wellpaths and six NEV covariance components (NN, EE, VV, NE, NV, EV). Of 6,396 total and source comparisons, 6,395 satisfy the applied acceptance rule. One Well 1 NE total differs by −0.000002527 m² at MD 1,620 m.
The charts below show full covariance overlays for each ISCWSA reference well. Published ISCWSA values are shown as dotted black lines and DirectionalPlan values are shown as solid blue lines so the overlay can be visually inspected.
R4 Clearance
Anti-Collision Ratio Comparisons
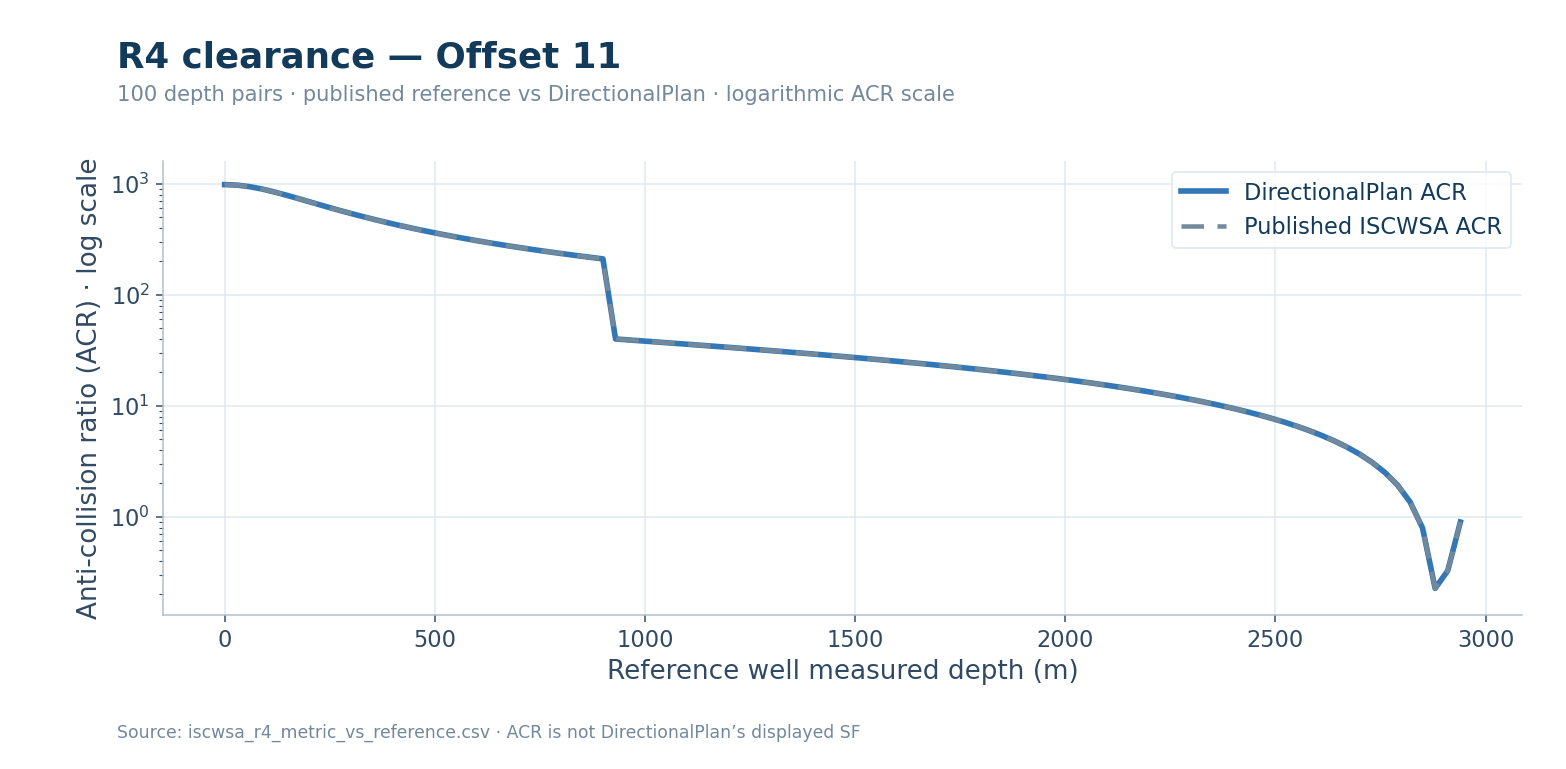
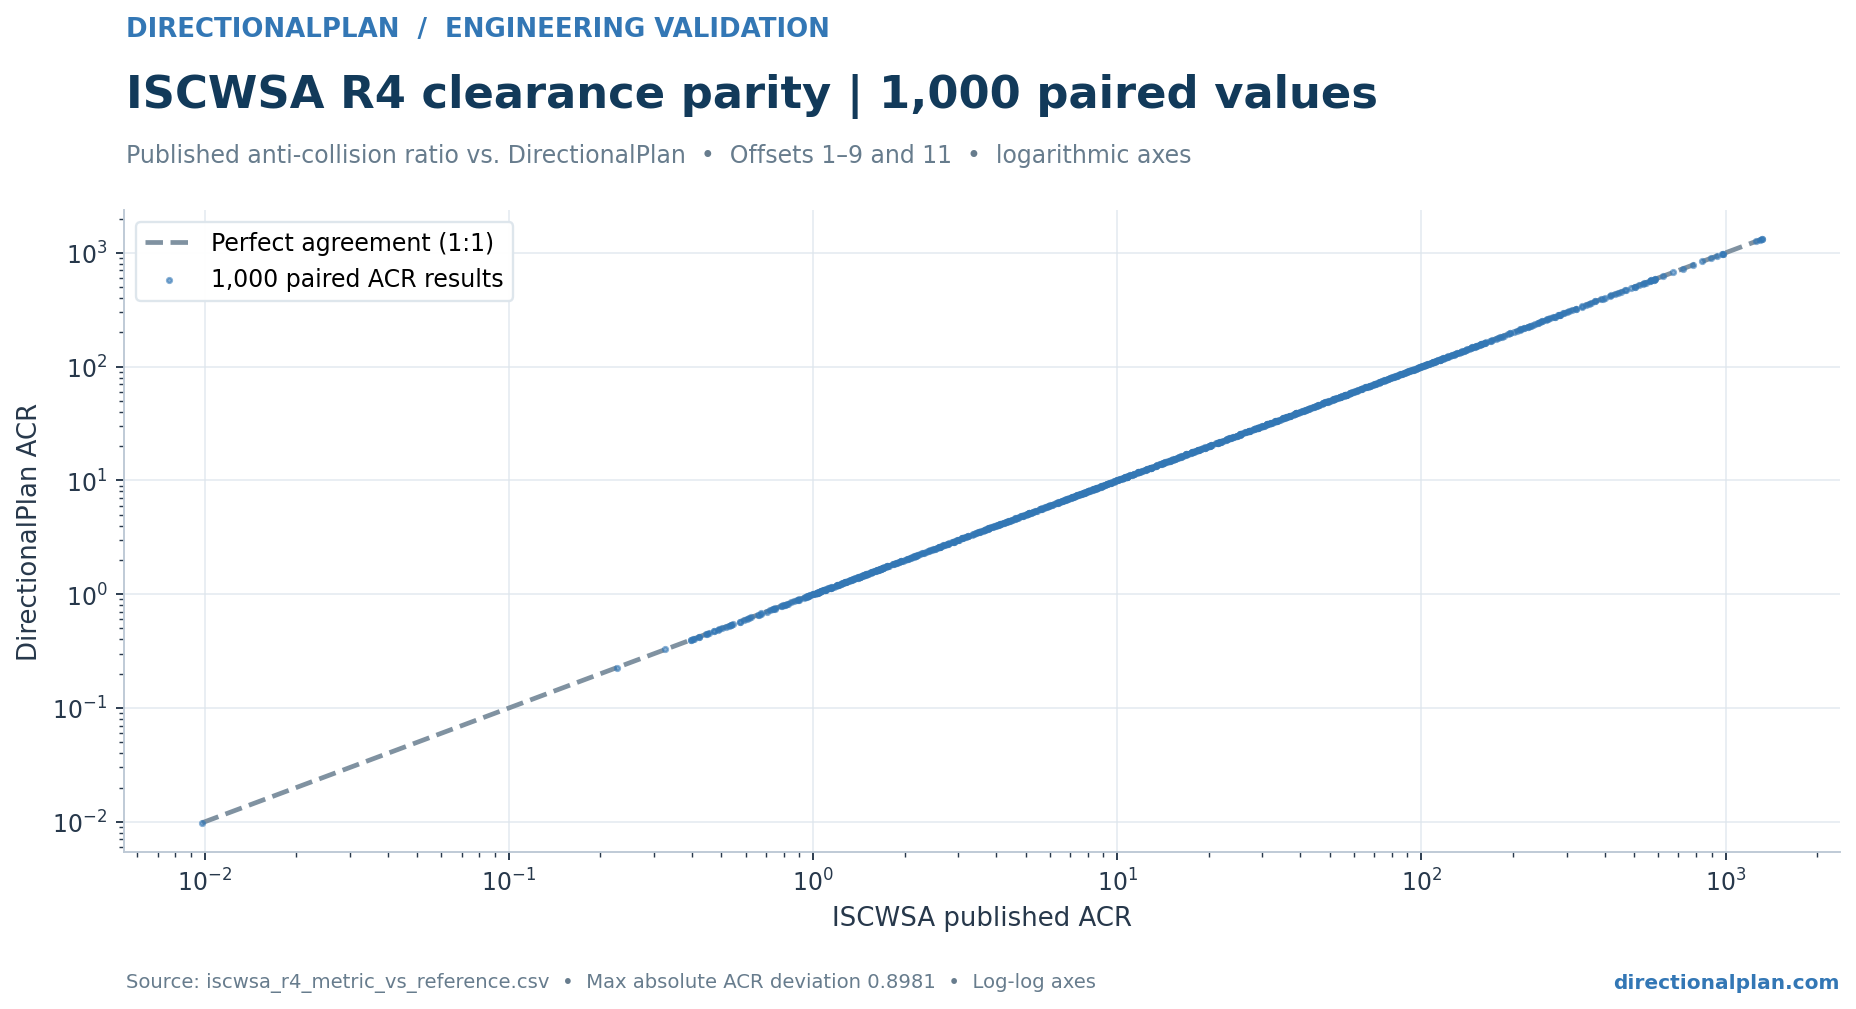
The supplied dataset contains 1,000 paired values: 100 measured-depth pairs for each of offsets 1–9 and 11. Offset 10 is not included in this export. These charts compare ISCWSA ACR, which differs from DirectionalPlan's displayed Separation Factor.
Numerical Differences
Residuals and Documented Exceptions
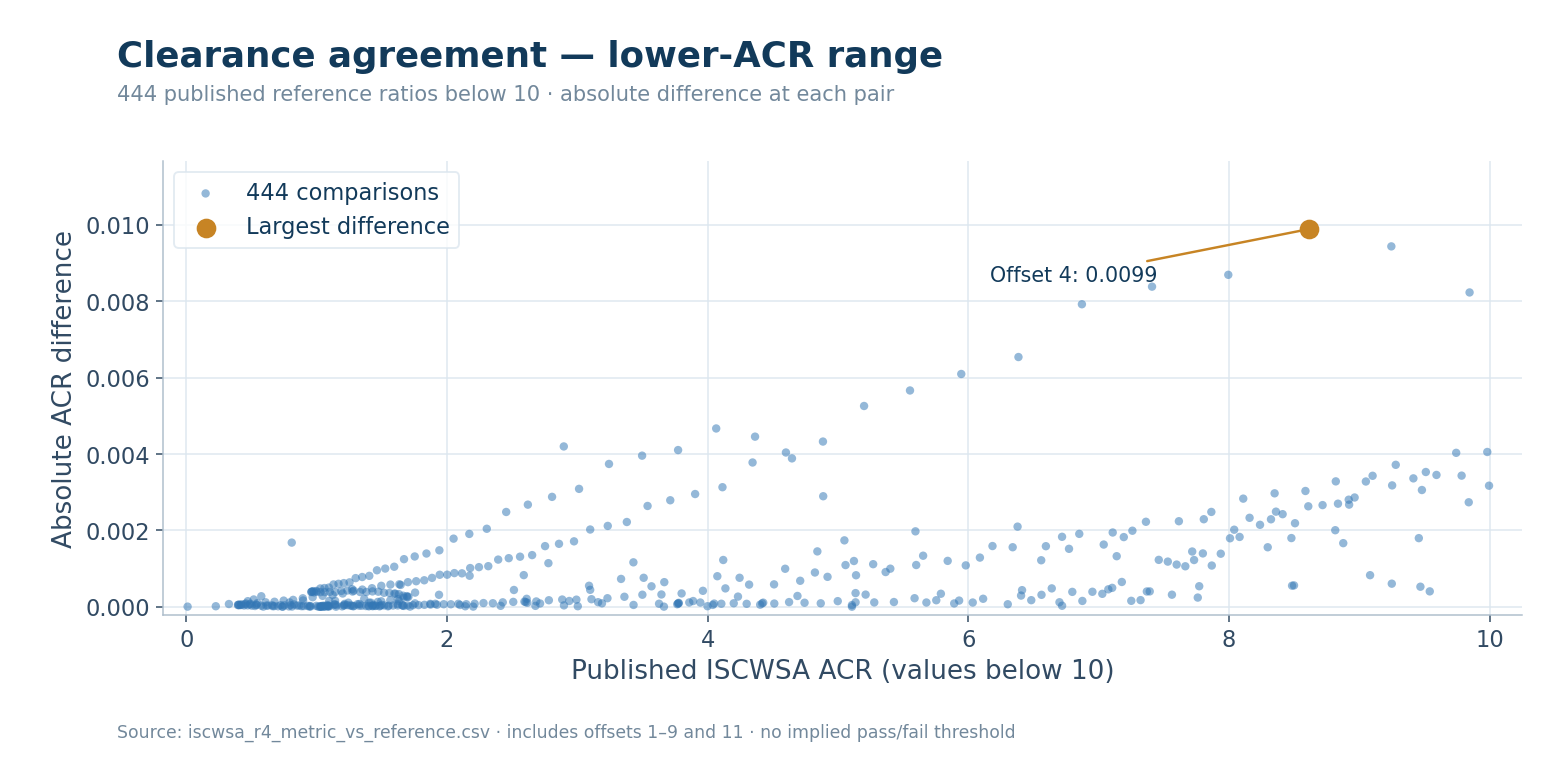
Among 444 comparisons with published ACR below 10, the largest absolute ACR difference is 0.0098925. The single covariance check outside tolerance is shown separately.
Scope and Sources
Interpreting the Comparisons
- Results were calculated by DirectionalPlan and compared with published ISCWSA reference examples, rather than independently certified by an external organization.
- The R4 dataset includes reference C-C distances, but not corresponding calculated C-C distances, so these files do not independently establish C-C agreement.
- Sidetrack reference checks are a separate test series, not represented in the R4 comparison CSV.
- The covariance comparison retains the original acceptance tolerance and one documented exception.